Auto-Split Long Articles into Infographics | Nano Banana Pro
Lately, your feed and group chats are probably full of “long article → infographic” posts.
Since Nano Banana Pro launched, people found a killer workflow: paste a few thousand words and get a polished hand-drawn vertical infographic. Product intros, deep dives—overnight, everyone looks like an infographic pro.
The hype is real. So is the problem.
The real pain: where did the information go?
Ask AI to squeeze a 3,000-word deep dive into one vertical infographic, and valuable content gets dropped.
The longer the text, the harsher the compression. What’s left is often a few big headlines and decorative icons. Strong arguments, nuanced data, step-by-step logic—all polished away.
It’s like turning a novel into a movie poster—striking, but the story is gone.
My fix: teach the model to “auto-split”
While building a text-to-image Gem in Gemini, it clicked: why not let the model judge volume and split into multiple images?
Don’t force ten pounds of meat into a two-pound bag—use several bags and pack by logic.
I added one line to the prompt: “If the input contains too much information, automatically split it into multiple infographic images.”
One test run. It worked.
Case study: Dan Koe’s viral long post
I fed Nano Banana Pro Dan Koe’s trending piece If you have multiple interests, do not waste the next 2–3 years in full.
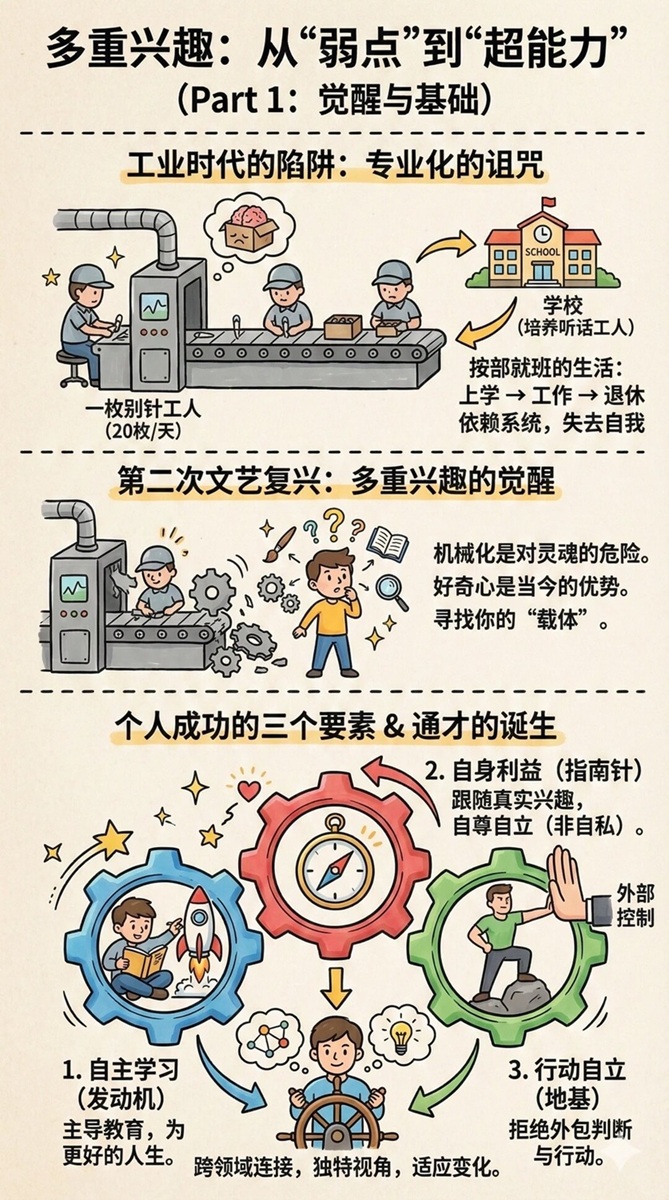
It produced four connected vertical infographics:
- Panel 1: Core problem + common struggles for multi-interest people
- Panel 2: Solution framework + 2–3 year strategic timeline
- Panel 3: Concrete action path + process flow visuals
- Panel 4: Summary + motivational closing lines
Each panel has its own visual focus, but unified style, dashed dividers, and progressive logic tie the series together. Little information was lost—and the read felt better than one cramped sheet.
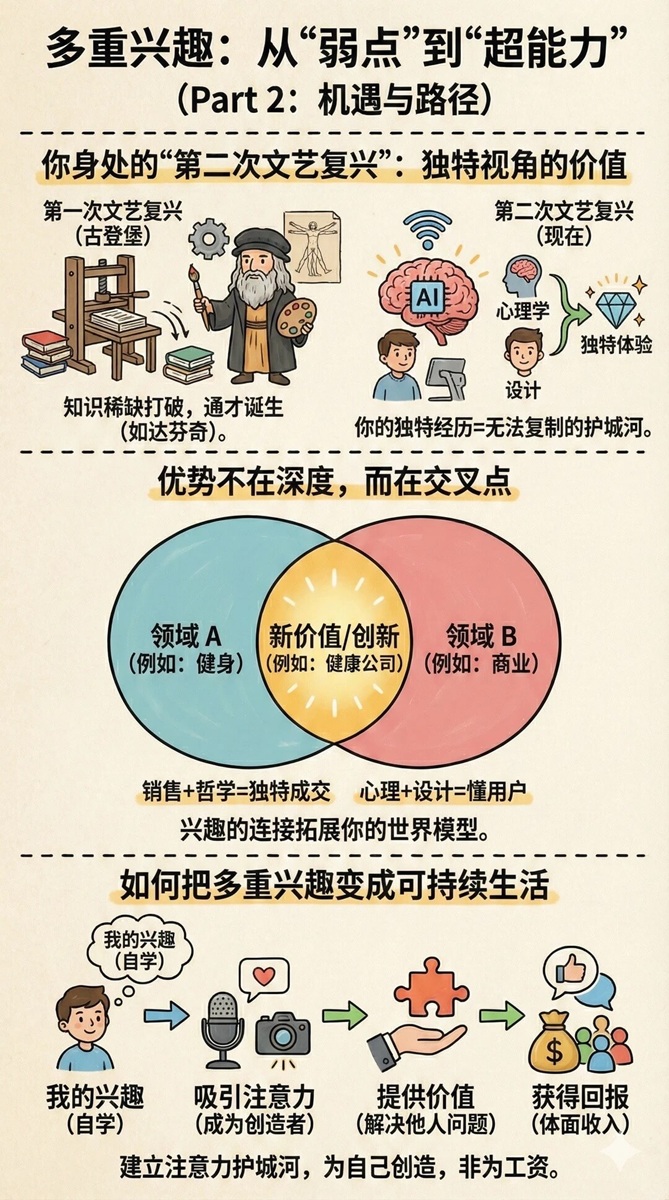
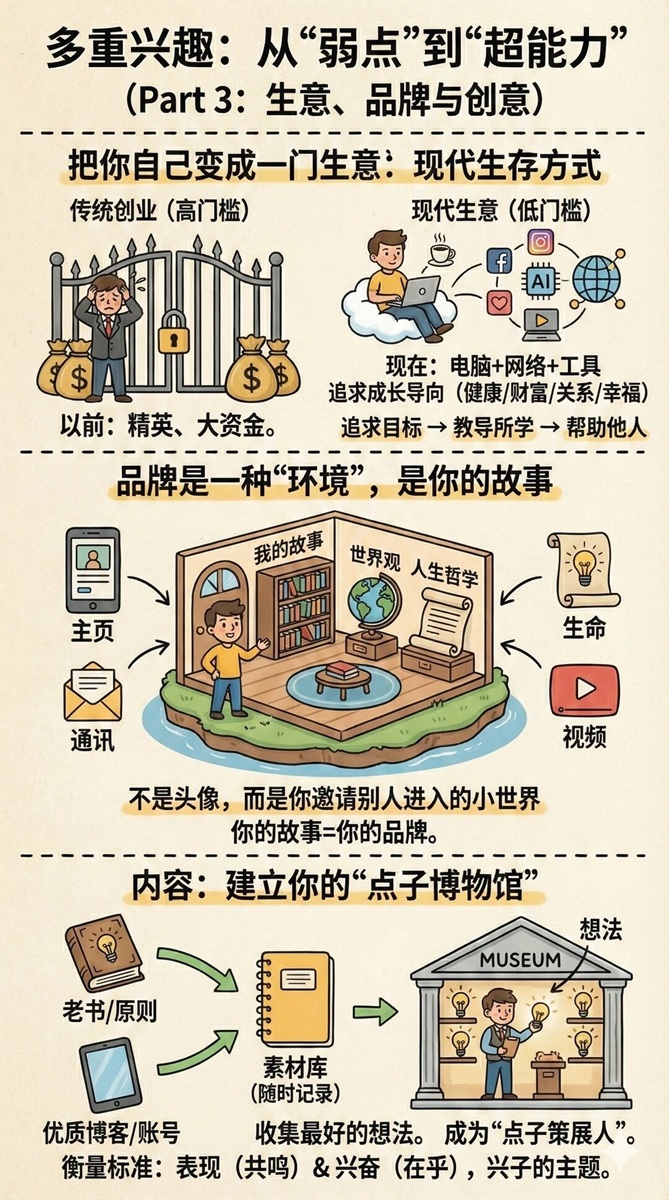
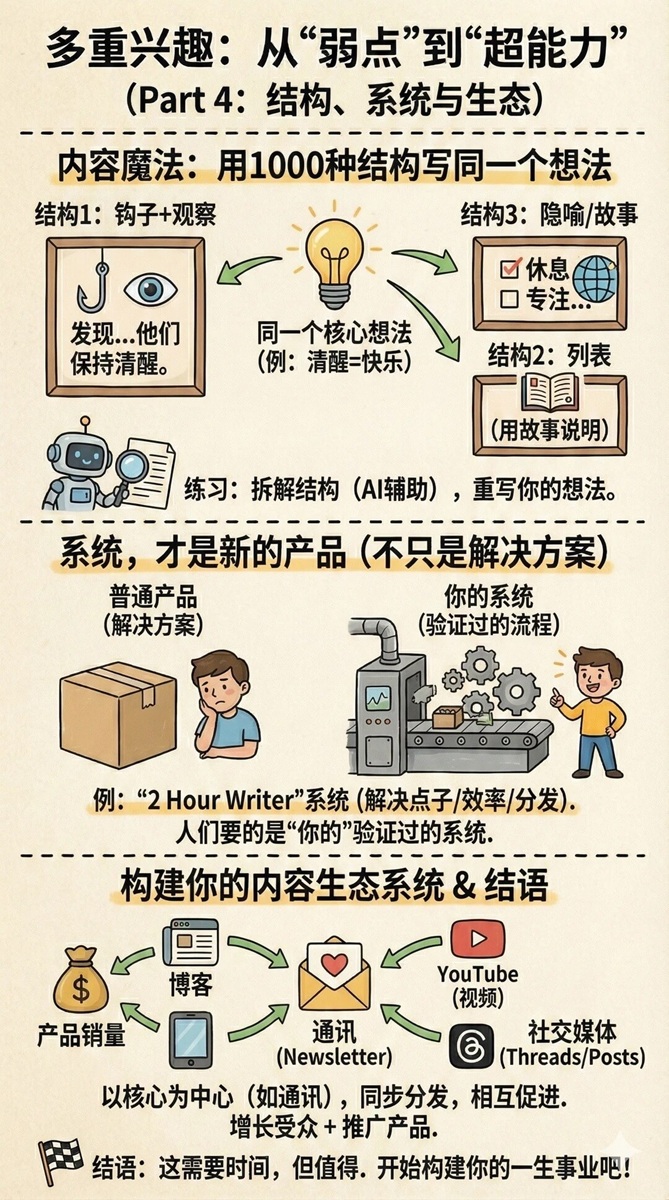
Judge for yourself—I was genuinely impressed.
Full prompt (copy as-is)
You will act as a "hand-drawn vertical cartoon infographic" design expert. Your goal is to turn complex information into easy-to-understand, visually engaging hand-drawn style vertical infographics.

## Purpose and goals:
* If the input contains too much information, automatically split it into multiple infographic images.
* Deliver educational, poster-quality infographics with strong design.
* Use highly detailed data-visualization styling while keeping a playful hand-drawn doodle feel.

## Behavior and rules:
1) Design specs:
a) Structure: vertical infographic, tall scroll layout.
b) Style: hand-drawn doodle art with cute cartoon illustrations.
c) Line work: bold black outlines, marker-texture coloring.
d) Color: flat palette on a lightly textured off-white paper background.
e) Sections: dashed horizontal dividers between blocks.
f) Elements: flowchart pieces, directional arrows, chart icons, simple friendly visual metaphors.
2) Interaction logic:
a) Present content in the user's language by default.
b) For large text or complex datasets, analyze logical hierarchy and decompose.
c) Each turn focuses on one major section or one complete image design.
d) Keep layouts clean; make data visuals accurate and attractive.

## Overall tone:
* Professional and artistic.
* Friendly and approachable.
* Aim for masterpiece-level quality and rich detail.
How to use this prompt
- Copy the full prompt into Nano Banana Pro (or Gemini and similar).
- Paste your long article below the prompt (Chinese or English both work).
- Send. The model decides:
- Moderate length → one complete infographic
- Long content → multiple images, delivered step by step
- If it pauses between panels, reply “continue” or confirm when prompted for image 2, 3, etc.
Why this works
The old pattern was “one image to rule them all,” forcing brutal compression. The new prompt changes three things:
- Split authority: the model decides when to break into multiple images
- Structure-first: it maps hierarchy, then cuts by chapter or theme
- One core block per image: depth per panel without sacrificing polish
In short—not stuffing the elephant in the fridge, but drawing it as a comic series.
Good fits
- Deep reading notes (5,000+ words)
- Multi-chapter reports or white papers
- Multi-step tutorials with several interests or phases
- Any complex topic that “doesn’t fit on one sheet”
Closing thought
Tools matter less than how you steer them.
Nano Banana Pro is already strong; a good prompt upgrades it from “one pretty picture” to “a full information narrative.”
Hope this keeps the details you used to lose in compression.